CBEST Exam – Charts, Graphs & Numerical Relationships
Here is some free sample CBEST exam practice for the charts, graphs, and numerical relationships part of the Math Exam. The answers to the questions are provided at the bottom of the page:
These questions are from our CBEST Math Practice Tests Instant Download.
Question 1: Which one of the values will correctly satisfy the mathematical statement below?
1/3 < ? < 7/9
A. 1/4
B. 1/5
C. 2/6
D. 3/6
E. 9/10
Comment: This problem is a numerical relationship type of exam problem. This exam question tests your knowledge of fractional relationships.
Tip: For this type of exam question, find the lowest common denominator of the fractions in the problem and of the fractions in the exam answer choices. Then compare the fractions.
CBEST Exam Graphs
Question 2: Use the graph below to answer the question that follows.
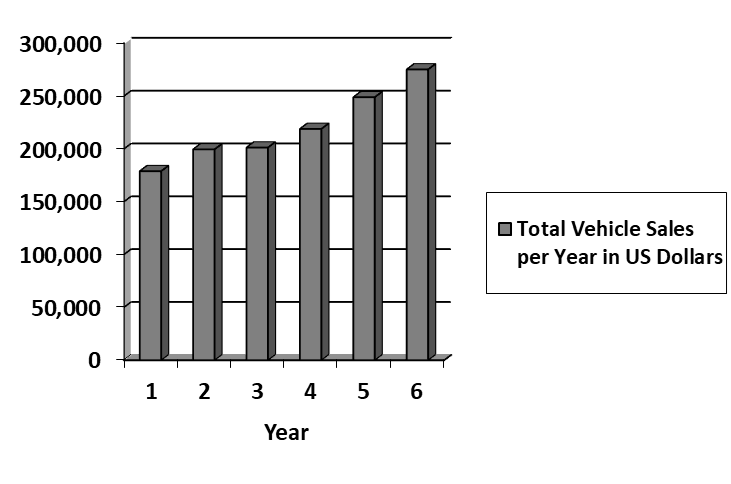
The increase in other vehicle ownership surpassed the increase car ownership by the greatest amount during which time period?
A. 1950 to 1960
B. 1960 to 1970
C. 1970 to 1980
D. 1980 to 1990
E. 1990 to 2000
Comment: This type of problem tests your ability to interpret graphical data. The exam section for math will have several questions on graphs and tables.
Tip: For this type of exam problem on the CBEST, you have to calculate the increase for each category for each time period. To answer this question on the exam, it is helpful to make notes or draw up a small chart to aid your comparison.
Question 3: Which of the following is equivalent to 2/8?
A. 12%
B. 20%
C. 25%
D. 40%
E. 50%
Comment: This math exam problem assess your ability to understand fractional and percentage equivalents.
Tip: To answer this type of exam problem, simplify the faction first. In this exam problem, 2/8 is equal to 1/4.
CBEST Exam Charts
Question 4: Use the pie chart below to answer the question that follows.
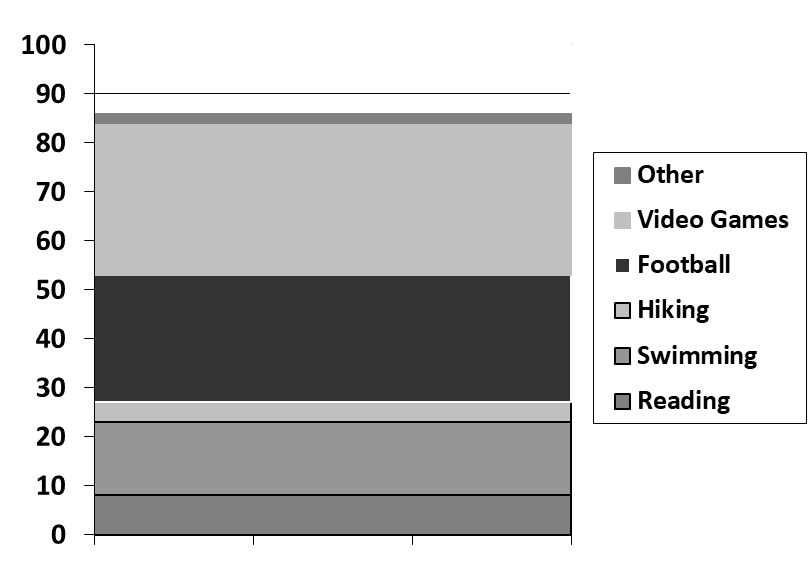
What percentage of students represented in the above graph have reading as a favorite hobby?
A. 2%
B. 12%
C. 20%
D. 22%
E. 32%
Comment: This type of problem on the CBEST assesses your ability to find data missing from a chart or graph. As stated previously, the CBEST Math Exam will have several questions on graphs and tables. Remember to look at the legend very carefully on the exam because some of the colors may be very similar.
Tip: To answer this type of exam problem, you must add all of the percentages given on the pie chart, then subtract from 100%.
Question 5: If the value of x is between 0.0007 and 0.0021, which of the following could be x?
A. 0.0012
B. 0.0006
C. 0.0022
D. 0.022
E. 0.08
Comment: This problem is a numerical relationship type of exam problem. Approximately 35% of the questions on the Math Exam involve understanding graphs, charts, or numerical relationships.
Tip: For this type of exam problem, remember to put all of the numbers in one column to compare them, lining up all of the decimal points.
Answers to the Sample CBEST Exam:
1. D
2. B
3. C
4. B
5. A